
Author: Xiaoliang Wang
Editor’s Note
The Gartner Hype Cycle is famous for successfully predicting the Internet bubble, which has been one of the most frequently cited models by entrepreneurs and investors over the past 20 years. This Cycle is also responsible for the evolution of technologies in their most simple forms, even though it was previously questioned for inaccurate predictions. Source Code Capital has engaged in deep research and analysis to better understand and interpret technological trends, as well as identify risks and opportunities. We exclusively present Source Code Research Report Issue No. 7.
Viewpoints
- Typically, models can skew information and are fractional pieces of information that belong to a broader topic. This can blindside those unwilling to research the topic deep enough to uncover the larger picture.
- It is extremely difficult to predict the future of technology. Even the Gartner Hype Cycle, an industrial consensus, is not necessarily always accurate when applied to the trend of emerging technologies.
- In light of uncertainty, it is advised to pursue a cognitive advantage rather than make a perfect prediction. Give changes and information disparities a second chance because they may end up becoming an advantage.
1. Perfect Hit or Coincidence
During the summer of 1999, Silicon Valley was in a joyous ecstasy. Catchwords in web technologies and e-business was in fashion, while those who kept silent about “new economy” and “new order” were outdated within the commercial society. A start-up company would double its valuation simply by adding an “e” or “.com” to its name. Wired even boldly predicted that in the following 25 years, the whole world would experience a technological revolution.
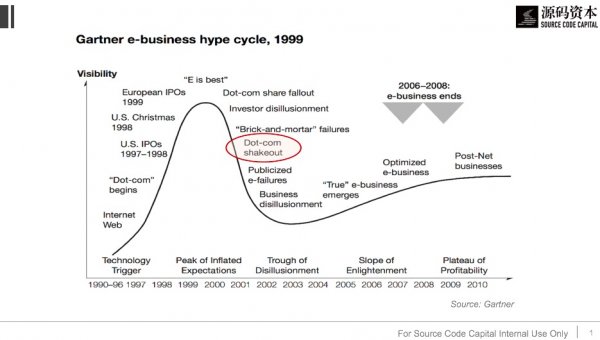
However, on the other side of the Atlantic Ocean, Alexander Drobik, an analyst from Gartner’s London Office, knew something was off. Having worked for years in the aircraft industry, this experienced IT practitioner previously witnessed a mature e-business application in air ticket booking and global distribution system. Drobik understood that e-business was not a revolutionary concept. Companies failing to make up their losses did not deserve a higher price than those with sound profitability in the market. Considering the well-known South Sea Bubble in 1720 and the listing craze of Internet companies, he illustrated the departure between market expectation and technological maturity on the Gartner Hype Cycle, which was created four years before in 1995. He then made the bold prediction that the Internet bubble would burst before 2001.
This concept was instantly rejected by Gartner (the company). It was after months of persuasion that, on November 9, 1999, the appraisal committee decided to publicize the research report for thousands of clients. Four months later, the U.S. stock market crashed as Drobik predicted. The NASDAQ index hit rock bottom just after reaching a historic high of 5,132.52 points, and almost halved by 2001. As a result, the Gartner Hype Cycle became quite famous in the industry.
More importantly, Drobik not only predicted the decline of e-businesses in 2001, but also the birth of “true” e-business after 2003. You will find that LinkedIn (2002), Skype (2003), Facebook (2004) and Twitter (2006) all emerged during this period. The Gartner Cycle became revolutionary from an industry and academia perspective, and people are now attempting to research trend predictions of emerging technologies.
2. “Not Accurate Enough” Statistically
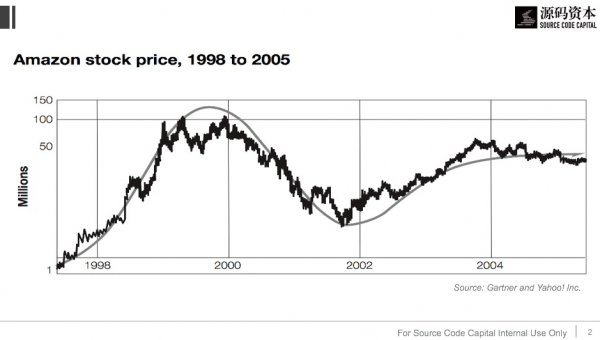
There are many published cases to justify the validity of the curve as long as you are willing to spend more time researching. For instance, the development path of Web technology companies and the shared price changes of Amazon and Yahoo between 1998 and 2005 relate to the curve. However, words like “hindsight” and “survivorship bias” apply to these events since they were full of uncertainties to begin with. We selectively filter out clues inconsistent with the status quo in order to make sense of narrations and the presumed model.
Questions that should be asked in order to eliminate a prejudice: How many companies failed to resurface? How many technologies once assumed to have a promising future, did not?
In 2016, Michael Mullany conducted some fascinating research. From 2000 to 2016, the investor of Icon Ventures analyzed over 200 pieces of emerging technologies and used the Gartner Hype Curve to discover the following:
- Many technologies that plummet after the hype speculation never resurfaced, roughly 50 of them only survive a year. Though technologies such as crowdsourcing (2013), HTML5 (2012), BYOD (bring your own device, 2012) and podcast (2005) are still used, what they have achieved can merely be called a major success.
- Only four major technologies experienced a complete cycle of “rise-fall-revival”: cloud computing (2008), 3D printing (2005), natural language searching (2002) and electronic ink (2000).
- Various speculations went ahead of their time regarding technological insights, but were reapplied years later due to improper application or immature market conditions: Web Service Enabled Business Model (2003; a model used by Twilio, Plaid, and others), public authentication service (2002; similar to the existing Oauth authentication), trillion-level architecture (2006; a mass computing system which can tolerate partial failure but eventually recover).
- The technological curve missed a number of major technologies: x86, NoSQL, Hadoop, and open source technologies were either invented too late or never showed up on the hype cycle.
In other words, if you are a CEO with a passion for “dark” technologies as a strategy, or an investor interested in early programs following the Gartner Hype Cycle, you may run into frustration. Statistically proven, predictions made by the Gartner Hype Cycle are not always accurate. The cycle will be valuable for second-order thinkers and those able to understand information dead zones.
3. Looking for Gold from Second-Order Thinking
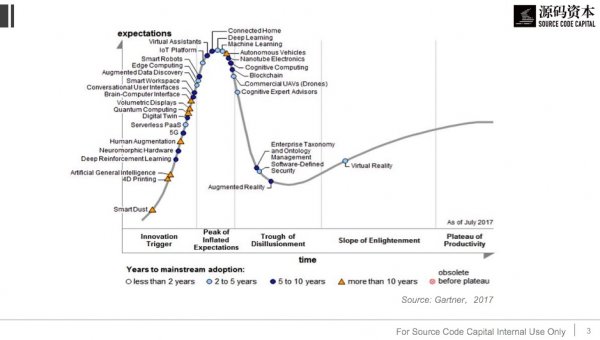
Let’s start with a simple case. The following graph is the emerging technology cycle published in July 2017, with 32 technologies. Suppose you are an entrepreneur, an investor, or a consultant, what are your first impressions?
- Look at the start: 5G technology and cutting-edge computers are listed for the first time and are highly anticipated;
- Look at the peak: Internet of things, platforms, and machine learning are thriving, and expected to mature in two to five years;
- Look at the trough: Expectations for augmented reality and virtual reality are returning to a reasonable level; virtual reality is believed to gradually show its application.
While these are all sound conclusions, it is hard to understand what they mean in terms of entrepreneurship, investment and business management. We must also understand how to judge and apply them. Analyzing the cycle further and looking at investment potential, for example, let’s draw a 4×4 matrix. The horizontal axis represents the time a product takes for wide application, which ranges from “less than two years” to “more than ten years,” matching four different marks on the Gartner Hype Cycle. The vertical axis refers to our anticipation of its business value, also divided into four levels. Then, we map the points on the cycle to the following matrix and adopt different investment strategies for distinctive technologies. For instance, if one has revolutionary value and can be widely applied in five years, we put it at the top of investment and research priority (the area in dark red). On the contrary, if one has a relatively high value but will not secure engineering and business maturity within five years, we should be cautious about its layout, and mainly focus on increasing our cognitive reserve (the area in yellow and grey).
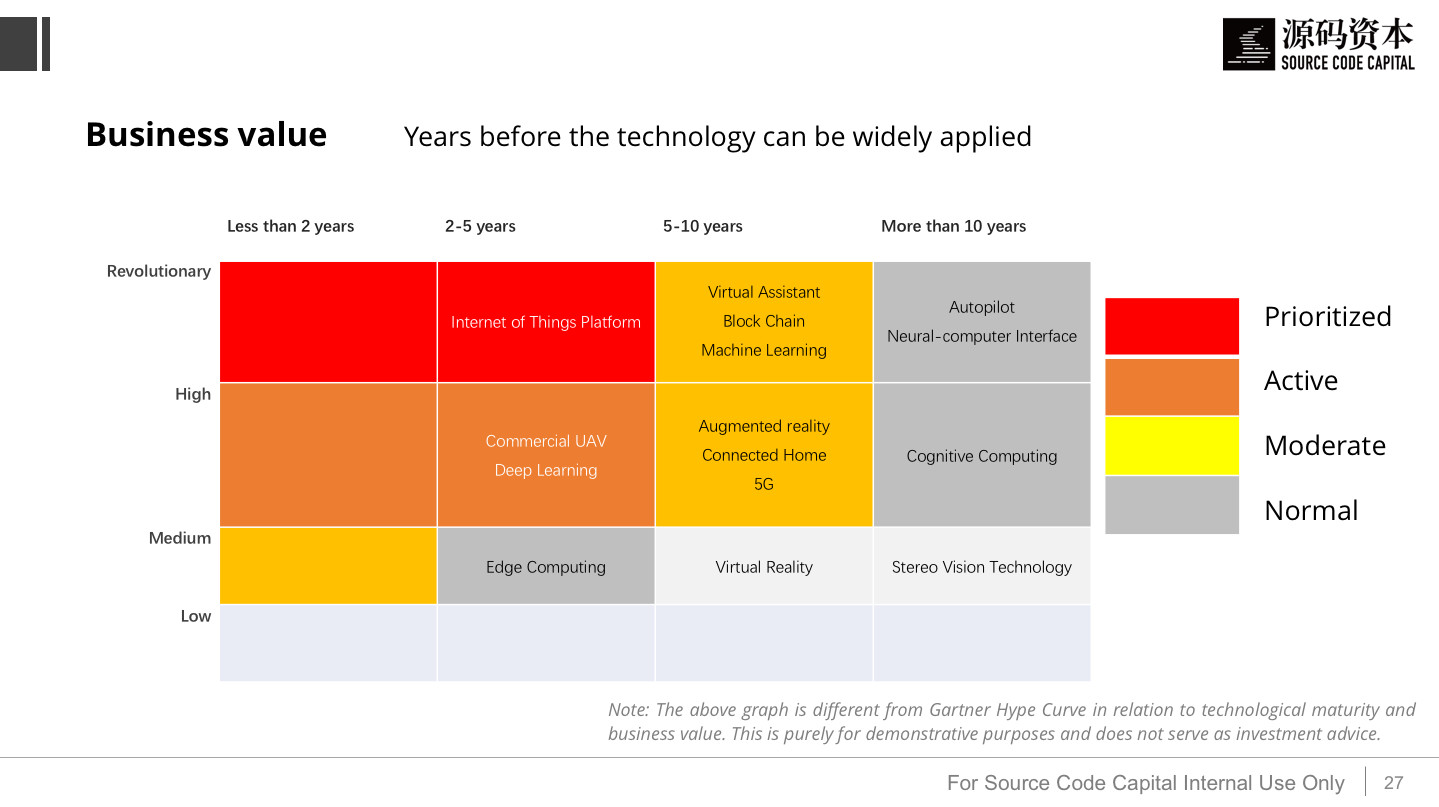
Note: The above graph is different from Gartner Hype Curve in relation to technological maturity and business value. This is purely for demonstrative purposes and does not serve as investment advice.
It is easy to find similar matrixes in annual Gartner reports (keyword: Gartner Priority Matrix). However, our ultimate purpose is not a formal transformation of the cycle. The value of information comes from differentiated thinking about changes. For instance:
(1) Evaluation accuracy: Are Gartner’s judgments on technological maturity and potential business value consistent with mine? Which are over-optimistic, and which are too conservative? Going off of that, how should the positions of these various technologies be adjusted within the matrix?
(2) Cognitive difference: Maturity comes from two dimensions, engineering and business. How does the maturity of different industries and different countries compare to these two dimensions? In the market that I care about, at what stage does technology come into play?
(3) Dynamic thinking: Which technologies appeared last year and not this year? Why do you think this is the case? Will media exposure shorten the maturity period of a technology? Which technologies may be replaced by new trends before they reach maturity?
The answers for these questions determine the quality of cognition. Keeping Peter Thiel’s edification in mind; he postulates that open secrets have no value and the laws that you believe in, which may bring you advantages, might not be true for other people.
Due to the article’s length limitations, we will prioritize the last question. If you are interested in the other questions, follow Source Code Capital’s articles related to this topic or find out more from the Q&A session at the end of this article.
CAO Yi, Source Code’s founding partner, put forward the principle of the “Triple Waves Phenomenon” in his article, Nine Snapshots of Technological Innovation:
Generally speaking, when the first wave of technology-driven influence is at full capacity, the second wave is already gaining momentum. Sometimes, the third wave is following closely behind. The most common example is China’s 2008 retail industry, which during the first wave, continuously improved the traditional retail industry through technological innovations. During the second wave, shopping malls such as Suning and Gome expanded nationwide through “technology,” “chain store expansion,” and acquisition growth. At that time, all market participants experienced over two-digit growths. However, China’s retail industry did not consider the third wave and was not prepared for the e-business or e-Commerce era, as represented by Taobao. This resulted in late comers excelling, while others were left at a stand-still.
However, this behavior is not unique to the retail industry. If you observe areas beyond the Gartner Hype Cycle, more uncommon cases will be found.
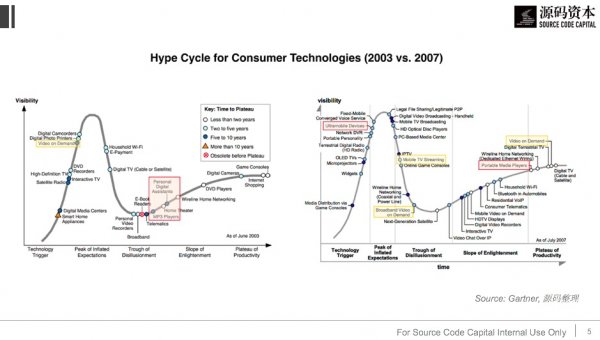
In 2003, Gartner predicted that MP3 players would become outdated, which applied to the emerging consumer technology cycle. In 2007, the technology did, in fact, reach its peak productivity. However, that same year, the original Ultramobile Device quietly gained popularity. This evolved into the Ultrabook laptop which influenced the creation of smartphones that exist today. The market for MP3 players imperceptibly disappeared with this emerging technology. It can be said that MP3 players only served as a sub-function of portable devices.
Video-on-demand is a similar piece of technology. In 2003, Gartner predicted it would be at least five to ten years before the technology would mature. In 2007, its business application was already in sight, with people working on faster and better video-on-demand technologies. However, ten years later, the most popular service turned out to be Mobile TV Streaming, which was the least promising platform of that time.
At this time, I would like to remind readers that emerging technologies may not always be the most successful. The best pioneers in this industry remain alert to changes and constantly update their thinking models. Technological advantages as a first-mover cannot always keep your business model unassailable. It is better to compare this to an ecological chain. All technological species continuously evolve and require generational updates to ensure its safety at every stage.
4. Dilemma of Sober Players
Finally, I’d like to draw your attention back to the summer when the Internet bubble burst.
In 2000, Forbes inquired about investment returns made to 550 VCs. Among those, Accel Partners and Charles River Ventures (CRV) reported that their investment returns in the fifth fund were 21.6x and 16.8x, which even today, are outstanding figures. Several years later, Accel invested in Facebook while CRV invested in Twitter. Nonetheless, neither received a return on investment that excelled past the figures mentioned above.
Per the Forbes article, Crosspoint Venture Partners has remained superior to all VCs. The returns of Crosspoint in 1996 reached 33.7x, which is to say that if you were an LP who put $1 of investment into that fund, you will have earned $29.6 with $4.1 remaining in your account by 2000. Even as the secondary market was experiencing a decrease, Crosspoint still managed to raise a superfund of $850 million in one go.
However, late this year, Crosspoint suddenly announced their plan to return the raised capital to LPs, and announced their intentions to impose an indefinite suspension on the next fund’s fundraise. Since this shocked the industry, Crosspoint’s partner, Rich Shapero, was pressed to offer an explanation. Shapero stated, “The collapse of the secondary market had rendered all of our previous forecasting models invalid… if the booming market was gone forever, there was no way we can deliver a satisfactory result… we did not want to destroy our splendid record… it is not a golden time for investment in any company.”
Selected from The Suicide of a Top VC by Liu Yuan, with adaption.
Food for thought: “It is not a golden time for investment in any company.”
The NASDAQ index did not fall back to 3,000 points until 2012. The only two years where the U.S. venture capital saw a negative IRR was in 1999 and 2000. More importantly, Crosspoint missed the opportunity for LinkedIn, Skype, Facebook, Twitter, Airbnb, and WhatsApp, which had been established in the last 12 years. Crosspoint’s long-time rivals NEA, CRV, Benchmark and Sequoia, however, stayed long enough to see these flourish.
Indeed, Crosspoint gave a clear and precise prediction of the Internet bubble and market recession. However, this prediction, on a larger scale, failed to provide fortune for anyone at the end of the day. VC is essentially a process of capturing “positive black swan events,” where many trials and errors with limited losses can always be compensated by scoring a hit with maximum benefits. When it comes to black swan events, the larger value matters more rather than the average value. To be more specific, it is impossible to successfully cross a river whose average depth is one meter because the risks of crossing only become apparent after you have already started crossing. Nassim Nicholas Taleb, an expert of black swan events, tried to draw attention to the risks of financial systems in his book a few years before the fiscal crisis broke out. His experience may serve as inspiration:
- Knowledge acquired through observation always comes with traps. It is hard to disprove the existence of black swans even if you have seen 10,000 white swans, which demonstrates the inherent limitation of the method of induction. When it comes to issues dealing with limited losses and unlimited benefits, your ignorance matters more than what you know. People trying to predict black swans through induction will, more often than not, find it a vain effort. In dealing with uncertain questions, it is much easier to prove that something is wrong rather than right through collecting evidence. The value of disproving is always underestimated.
- People tend to make two mistakes when they use scientific models. First, they improperly abstract and simplify the problems. For instance, it is a tendency for people to generalize with a distribution of 80/20 by mean value, regardless of the variance in variables. Secondly, people tend to inaccurately draw conclusions. The inside of complex systems are imperceptible and interdependent non-linear relationships. If you only focus on how to adjust your own understanding of common events at a micro level and try to make new events adapt to old models, the final model will be too complicated and deviate from real scenarios.
It is important to study Taleb’s opinion for a true understanding of what this means. He attempts to explain that it is not “what you can do,” but “what you should not do.” According to Taleb, people do not pay enough attention to knowledge so our language cannot render precisely, thus, relying too heavily on models built by humans. As a result, we are destined to fail when the model does not align with reality.
Whether it is the Gartner Hype Cycle, Michael Mullan tracing the curve, or the prediction of the world post-bubble by Crosspoint; these pieces are all merely part of the larger picture. It is necessary to keep a clear mind about the different individual parts; we should not overlook anything because we are confident in what we believe to be true. It is very possible that your ignorance can play a significant role on the outcome of the bigger picture. Remaining modest and continuously expanding your cognition will empower you as a professional and as an individual.
5. One More Thing
While explaining the Gartner Hype Cycle, I circumvented a few distracting technical details. The following reflections may serve as notes and supplements.
Q1: How did they come up with the Gartner Hype Cycle? Is it built upon empirical research?
A1: Many people who frequently quote the Hype Cycle do not know that the cycle is in fact, made up of two curves. The first is the Hype Level, showing the hype expectations for technology in relation to media and the public. The second indicates engineering and business maturity. When the two are aligned, the Y-axis refers to the real expectation, while the X-axis represents evolution over time.
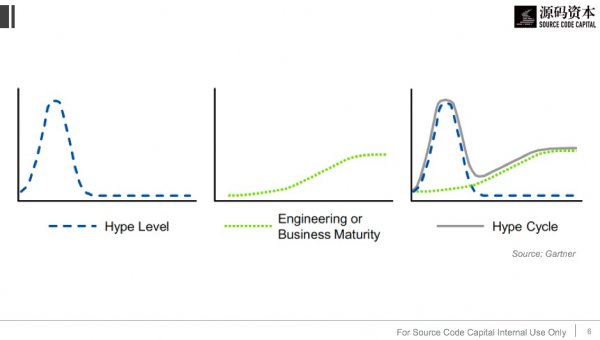
Hype refers to the exaggeration of a promotion. When a technological breakthrough is made or when new products are introduced, the media will buzz around the topic. Expectations and rumors about the products possibilities will increase public interest. However, as it lives on the market, mishaps involving the product will also be reported by the media, and the hype from the promotion will disappear. This is the inherent logic of the Hype Level; peaking at the early stage and descending later. It is common sense that innovation in technology occurs regularly in engineering and with businesses.
It should be noted that, currently, there is no standard index to measure hype and expectation (shown by the Y-axis). There is also no standard index for measuring the maturity of technology and businesses. The Gartner team determines the location of various technologies on the curve by interviewing industry experts and practitioners who analyze and predict data. Therefore, this method is subjective to a certain extent. Also, it is improper to view the cycle in a quantitative manner. It is more useful for qualitatively reveal the deviation of all technologies between expectations and reality.
Q2: Does the Gartner Curve have any other forms? Are there any variants?
A2: It comes in many forms; some technologies may even go through phoenix nirvana. When it is introduced, the technology receives much hype, then its popularity goes down since the underpinning technology is immature. Several years later, however, it is rediscovered by the public and defined as major progress in technology innovation. A new round of hype kicks off at this time, and the curve may experience double peaks, with the second one higher than the first. A good example is virtual reality, can you imagine the hype when it initially showed up on the Gartner curve in 1995?
Apart from the Hype Level, another dimension to consider is maturity. Technology may not necessarily follow the linear growth model, and for some, it may take less time to reach maturity. Reasons for this may be:
- It is easy to use with low safety risks. Hence, it can expand from customer-oriented (2C) to business-oriented (2B) in a short period of time.
- Certain pieces of technology are highly visible with strong demonstration effects. When used by others, it is easily shared.
- It is promoted by many suppliers at the top of the industrial industry, or it is easy to rely on the existing infrastructure for its development.
The chart below illustrates the moment when a piece of technology is in the process of rapid improvements. However, some technologies may go through decades of changes and adjustments due to basic scientific research developing more slowly than anticipated. Some examples of this are artificial intelligence and Nano computing.
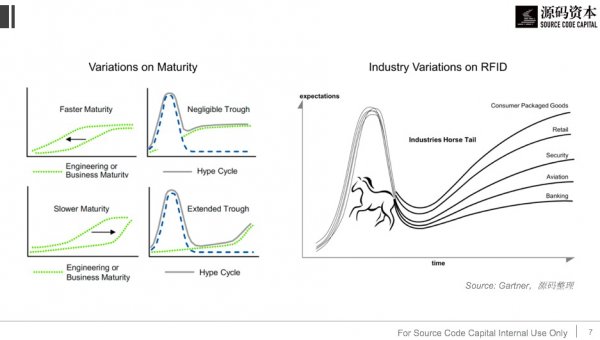
Another variant is the Horse Tail Effect, which is used to describe technologies on the brink of maturity, but it may require various developmental techniques for different industries. The upper-right chart about RFID is a prime example; this technology was highly anticipated by diverse industries in the 1990s. Eventually, there was widespread application in FMCG and retail, but it failed in separating goods within the aviation industry.
Variation in space and time should be taken into consideration as well. Technology may be produced similarly, but it can fill different positions in different countries. The Time Machine theory proposed by Sun Zhengyi was the first to create business models in the U.S. and other developed countries, which then made its way into Japan and China. The experience gathered by pioneers through trial and error serves as a lighthouse for late comers. This information will accelerate the maturity of the technology needed in underdeveloped areas, thus generating opportunities for arbitrage.
